pprof
使用该工具可以对程序做如下分析:
- CPU Profiling:CPU 分析,按照一定的频率采集所监听的应用程序 CPU(含寄存器)的使用情况,可确定应用程序在主动消耗 CPU 周期时花费时间的位置
- Memory Profiling:内存分析,在应用程序进行堆分配时记录堆栈跟踪,用于监视当前和历史内存使用情况,以及检查内存泄漏
- Block Profiling:阻塞分析,记录 goroutine 阻塞等待同步(包括定时器通道)的位置
- Mutex Profiling:互斥锁分析,报告互斥锁的竞争情况
对于不同类型的程序,使用的库也是不同的
- runtime/pprof:主要用于应用程序,比如计算斐波那契
- net/http/pprof:(其实是上面那个库的http封装而已),主要用于web服务器,或者服务进程
net/http/pprof使用
在运行的main函数或者test函数中起一个goroutine,用于pprof监控使用,demo代码如下
import _ "net/http/pprof"

func main(){
    go func() {
		//mux := http.NewServeMux()
		//mux.HandleFunc("/go", func(w http.ResponseWriter, r *http.Request) {
		//	num := strconv.FormatInt(int64(runtime.NumGoroutine()), 10)
		//	w.Write([]byte(num))
		//})
		//http.ListenAndServe("127.0.0.1:9001", mux)
		http.ListenAndServe("127.0.0.1:6060", nil)
	}()

    .....//其他代码
}
启动运行之后,可以使用命令行做交互,如下
命令行交互界面
>#go tool pprof http://127.0.0.1:6060/debug/pprof/heap  # 用于获取程序的堆栈内存信息

Fetching profile over HTTP from http://127.0.0.1:6060/debug/pprof/heap
Saved profile in /Users/zhoushengzhao/pprof/pprof.alloc_objects.alloc_space.inuse_objects.inuse_space.018.pb.gz
Type: inuse_space
Time: Mar 9, 2020 at 4:29pm (CST)
Entering interactive mode (type "help" for commands, "o" for options)
(pprof) top 3   # 获取暂用内存top 3
Showing nodes accounting for 5.12MB, 81.31% of 6.29MB total
Showing top 3 nodes out of 27
      flat  flat%   sum%        cum   cum%
       2MB 31.83% 31.83%        2MB 31.83%  WebIDS/ngnet.NewStreamDataBlock
    1.99MB 31.68% 63.51%     1.99MB 31.68%  github.com/google/gopacket/tcpassembly.(*pageCache).grow
    1.12MB 17.79% 81.31%     1.12MB 17.79%  bytes.makeSlice
- cum: 变量占用的内存大小
- 获取 cpu信息
go tool pprof http://localhost:6060/debug/pprof/profile?seconds=10  # 收集10s信息

Type: cpu
Time: Mar 9, 2020 at 5:25pm (CST)
Duration: 10s, Total samples = 580ms ( 5.80%)
Entering interactive mode (type "help" for commands, "o" for options)
(pprof) top
Showing nodes accounting for 580ms, 100% of 580ms total
Showing top 10 nodes out of 41
      flat  flat%   sum%        cum   cum%
     150ms 25.86% 25.86%      150ms 25.86%  runtime.pthread_cond_wait
     130ms 22.41% 48.28%      130ms 22.41%  runtime.nanotime
     130ms 22.41% 70.69%      130ms 22.41%  runtime.pthread_cond_timedwait_relative_np
      50ms  8.62% 79.31%       50ms  8.62%  runtime.usleep
      40ms  6.90% 86.21%       40ms  6.90%  runtime.madvise
      40ms  6.90% 93.10%       40ms  6.90%  runtime.pthread_cond_signal
      10ms  1.72% 94.83%       10ms  1.72%  runtime.exitsyscallfast
      10ms  1.72% 96.55%      170ms 29.31%  runtime.findrunnable
      10ms  1.72% 98.28%       10ms  1.72%  runtime.pthread_mutex_unlock
      10ms  1.72%   100%       10ms  1.72%  runtime.treapIterFilter.matches
- flat:给定函数上运行耗时
- flat%:同上的 CPU 运行耗时总比例
- sum%:给定函数累积使用 CPU 总比例
- cum:当前函数加上它之上的调用运行总耗时
- cum%:同上的 CPU 运行耗时总比例
- 其他命令
go tool pprof http://localhost:6060/debug/pprof/block
go tool pprof http://localhost:6060/debug/pprof/mutex
Web交互界面
使用浏览器访问 http://127.0.0.1:6060/debug/pprof/可以得到如下页面
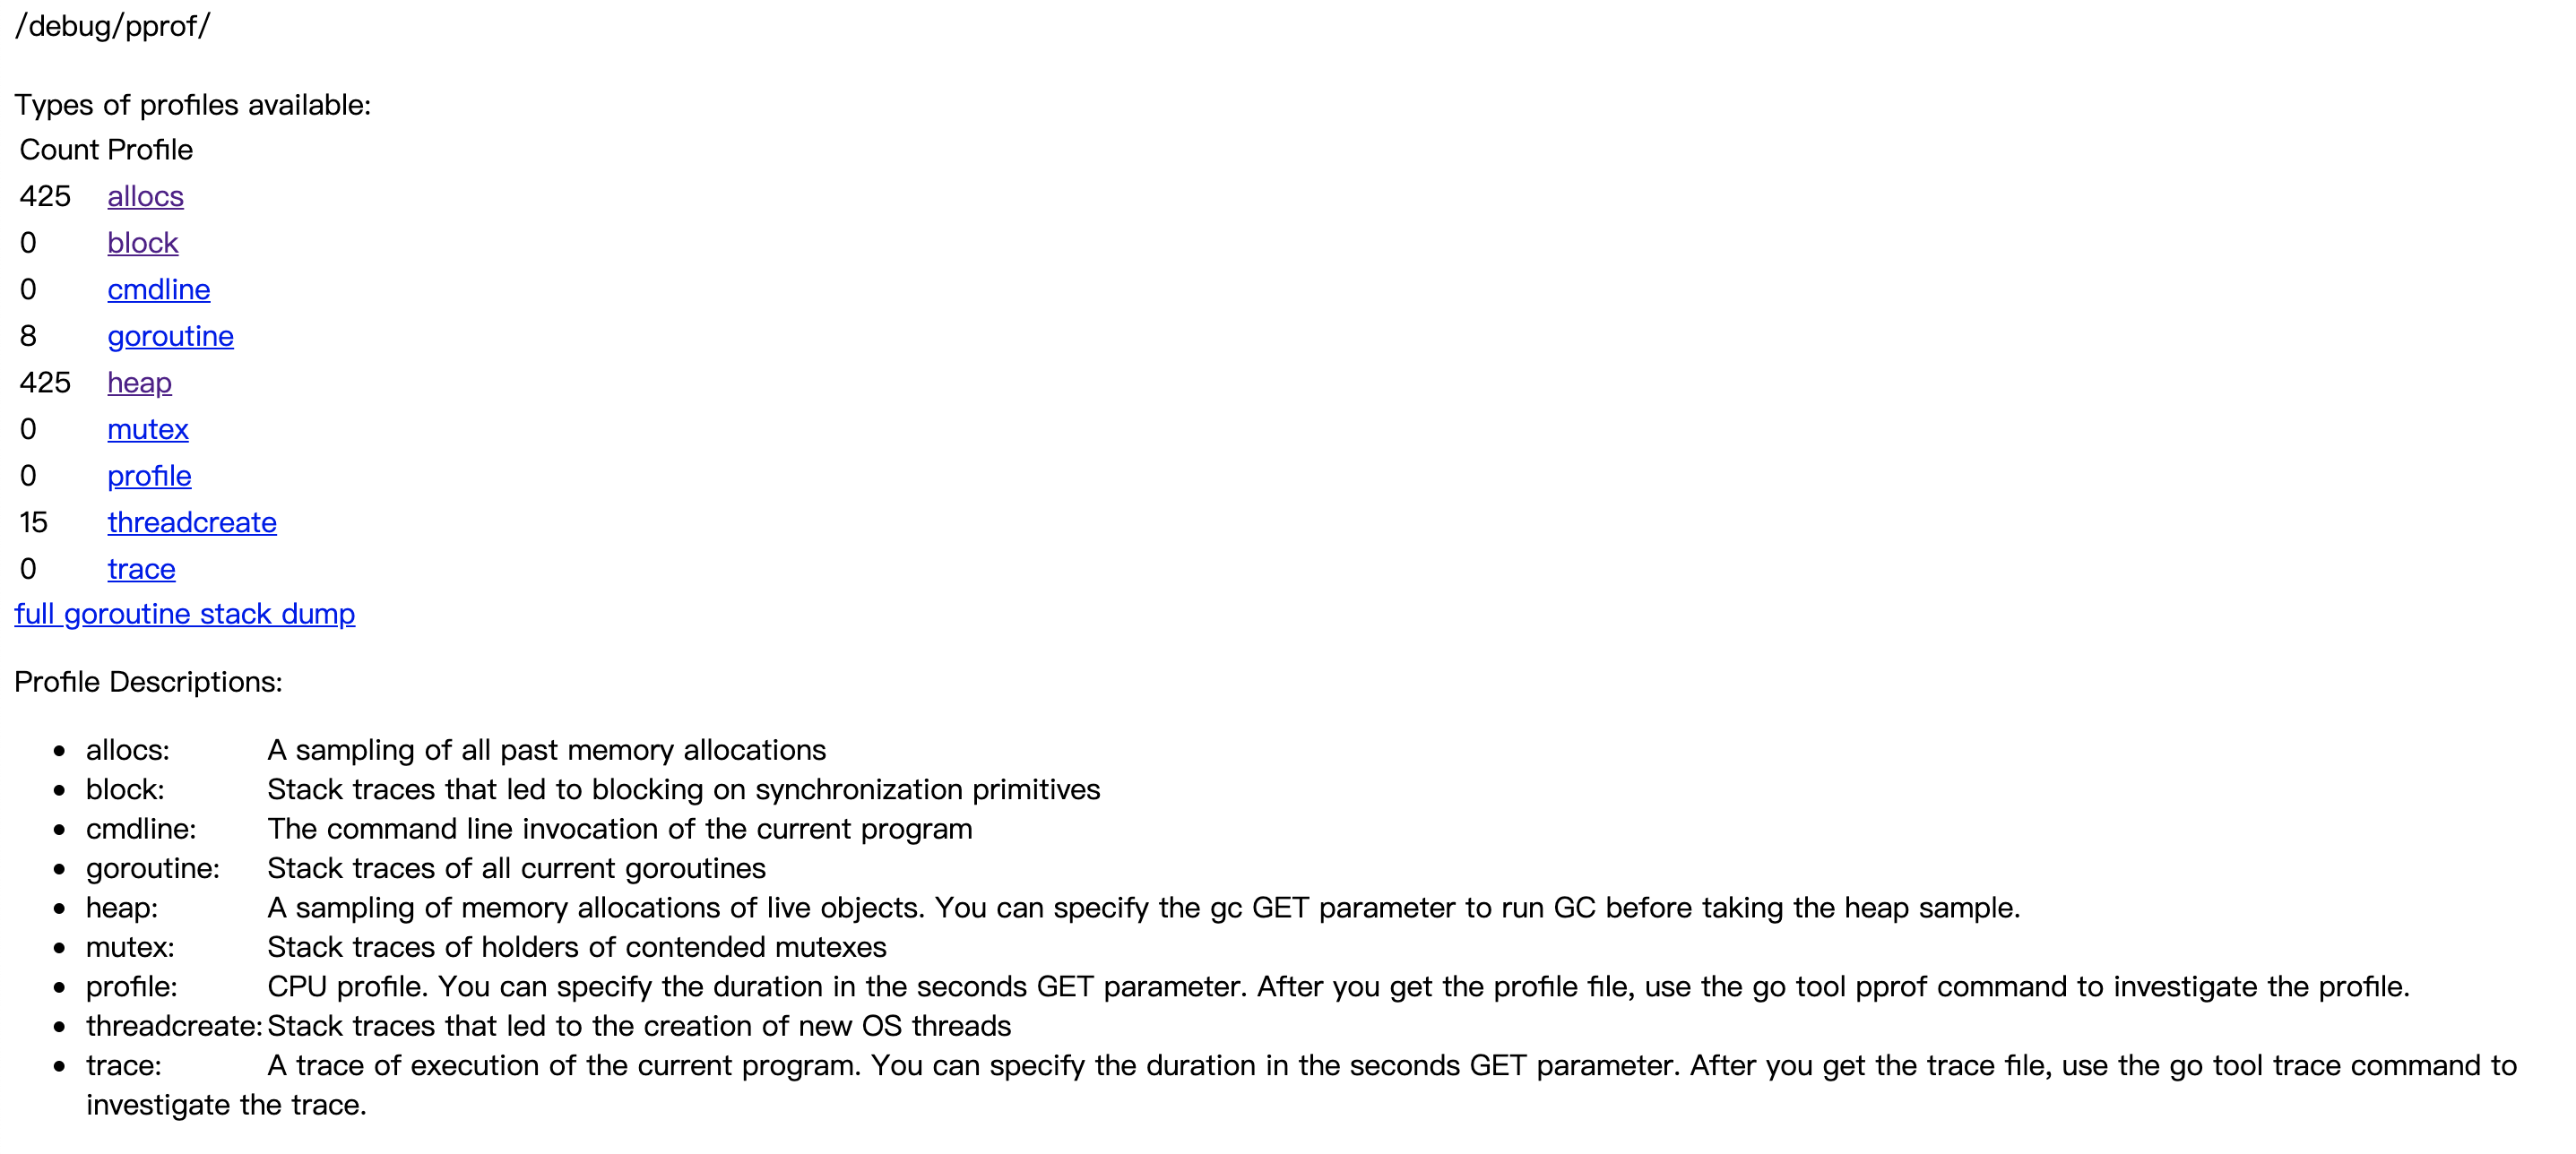
pprof可视化页面
在使用该可视化界面之前,我们需要安装Graphviz
brew install Graphviz
- 实现需要导出一个监控文件,以test为例
进入相关目录
go test -cpuprofile=cpu.prof

-
启动 PProf 可视化界面
方法一
go tool pprof -http=:8080 cpu.prof
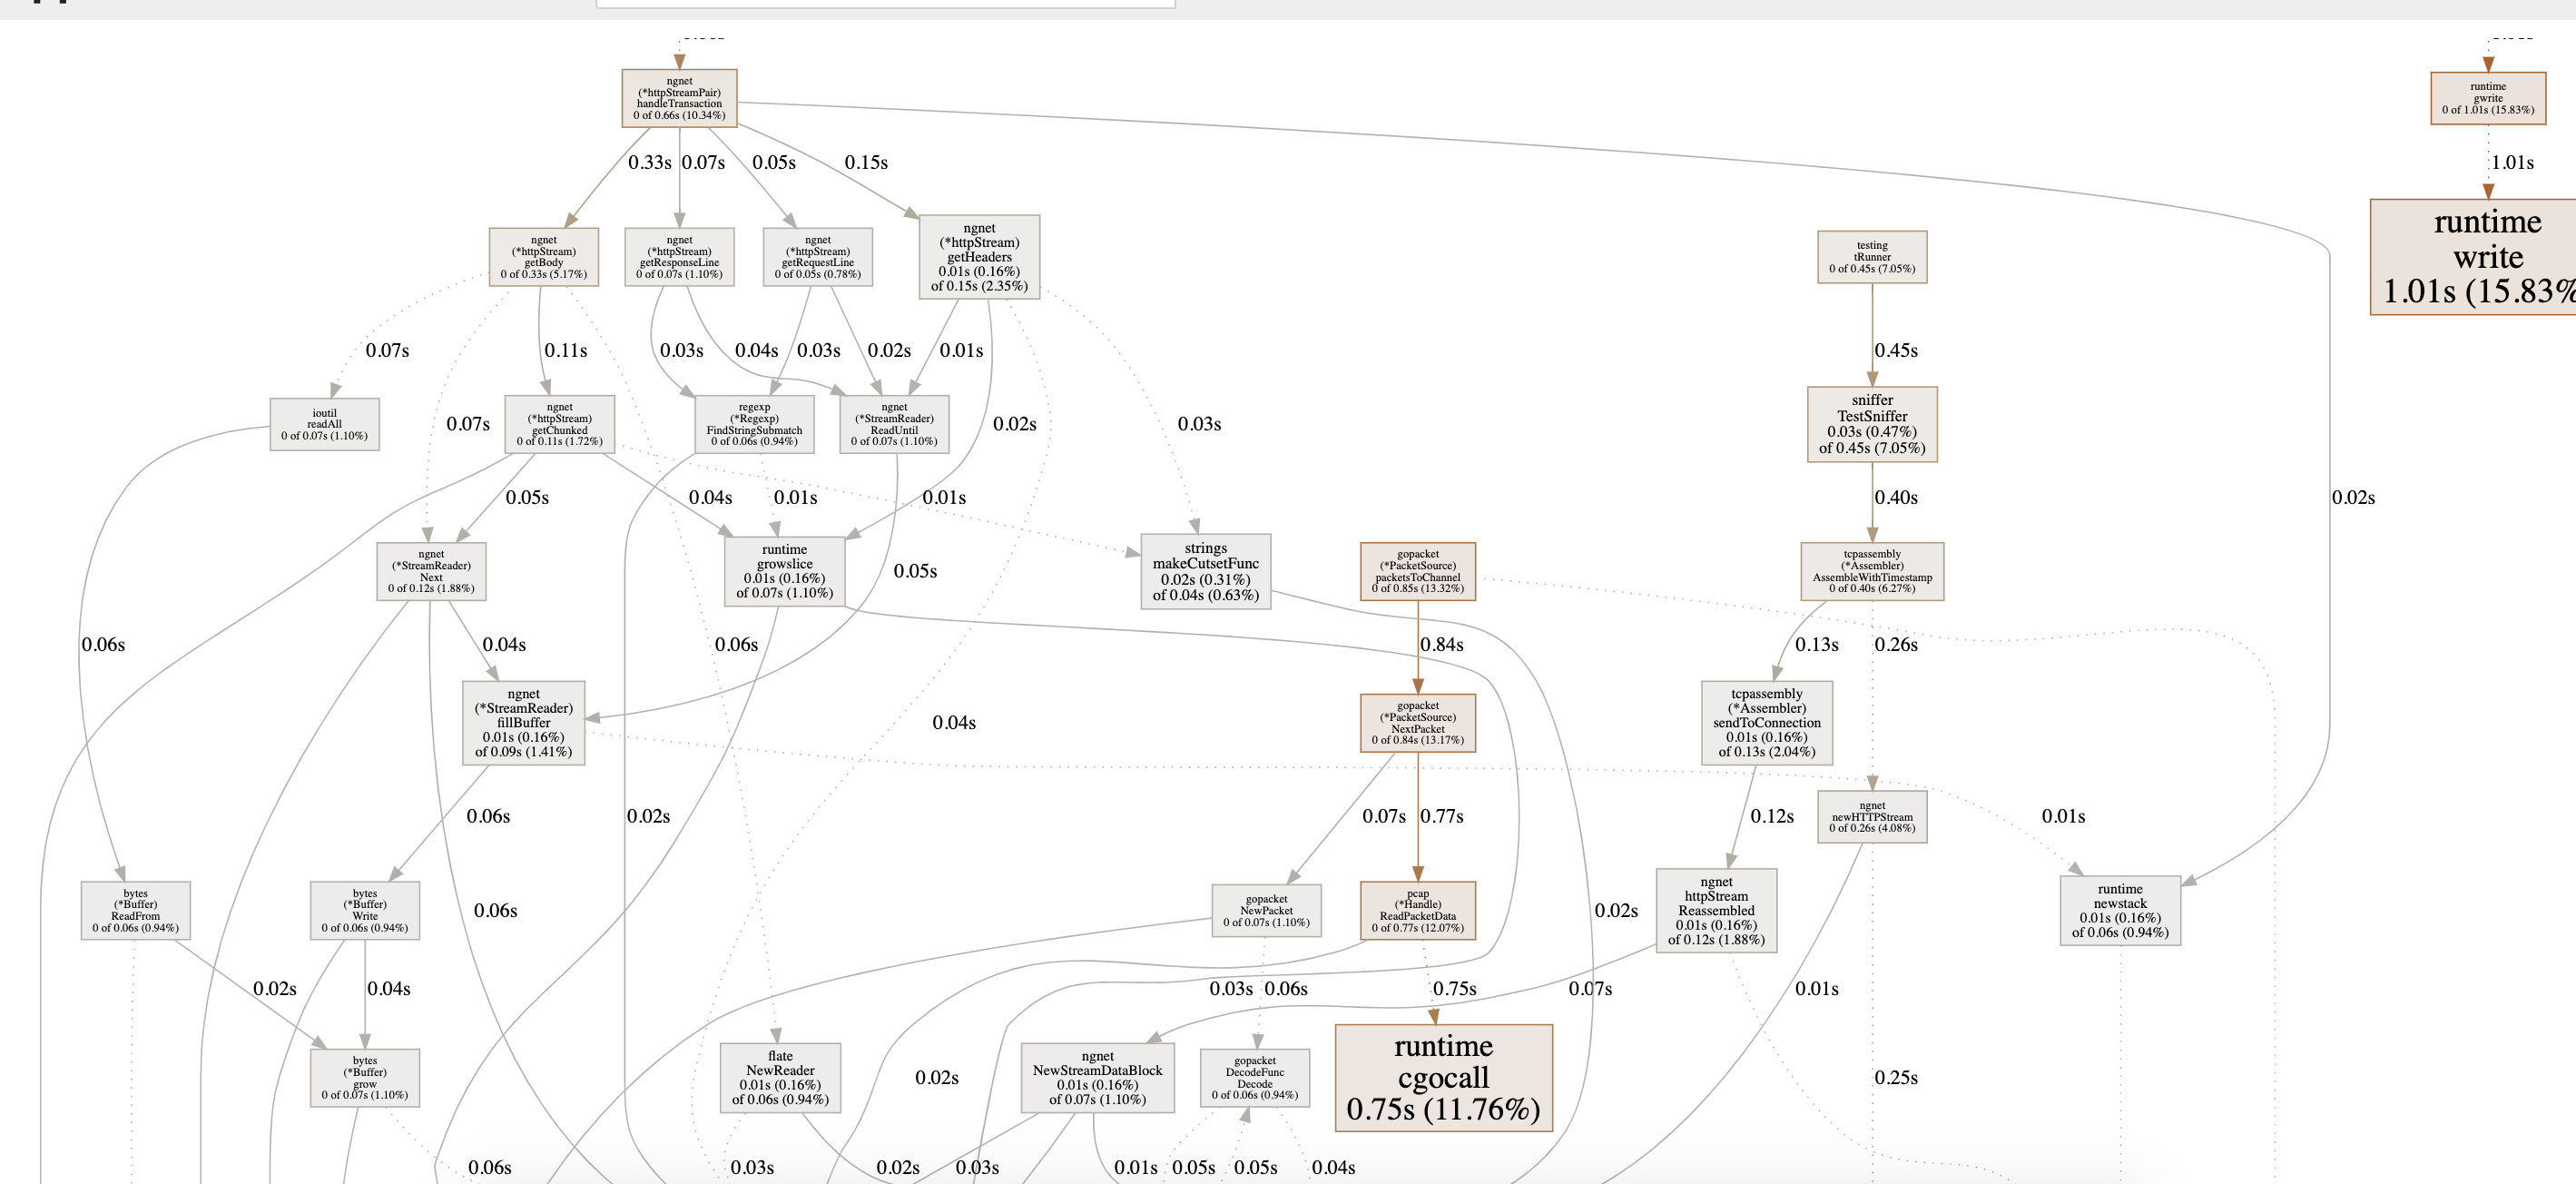
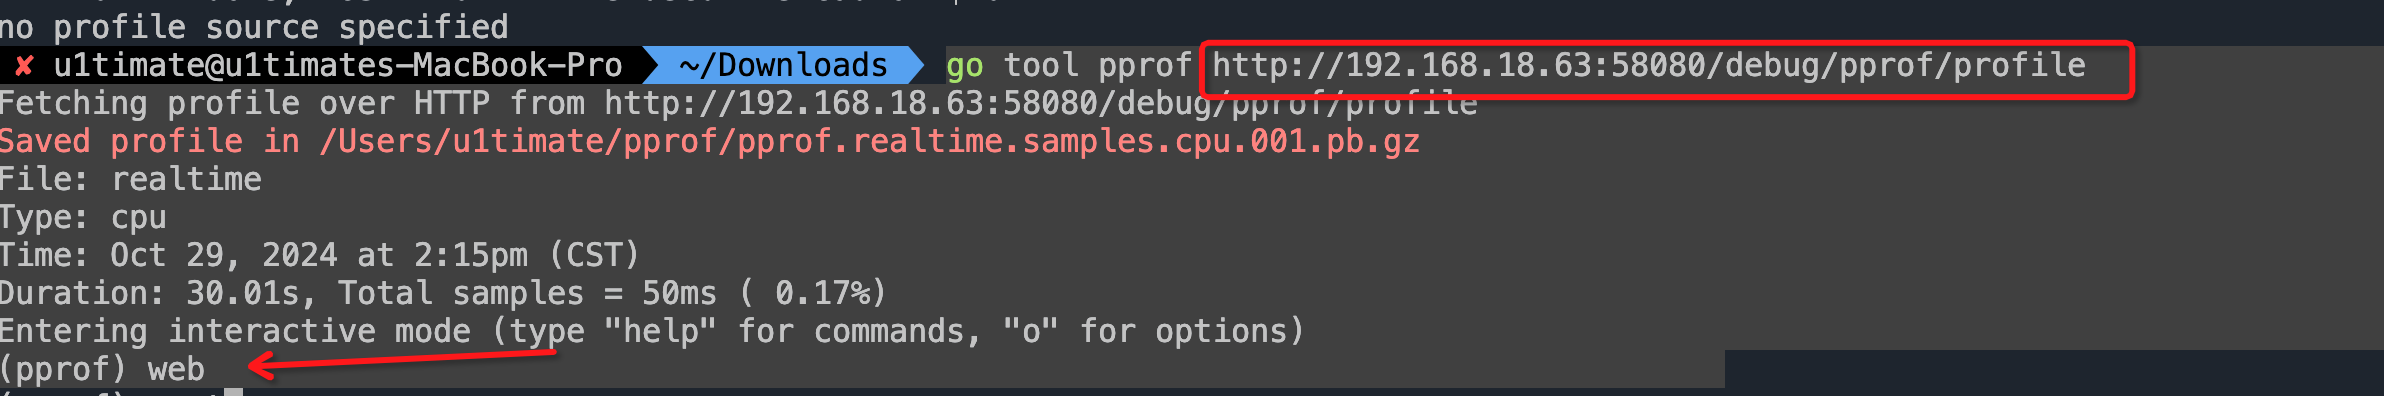
方法2:go tool pprof $host/debug/pprof/profile然后输入web命令即可生成svg图片